Studying Stress Distribution Under Steel Base Plates Using IPE Profiles.
Seyed Mojtaba Athar1 * , Marjan Sadrjamali2 and Mojtaba Bahrami Noshahr3
1
Department of Civil Engineering, Sama Technical and Vocational training College,
Islamic Azad University,
Ardabil Branch,
Ardabil,
Iran
2
Department of Civil Engineering,
Mohaghegh Ardabili University,
Ardabil,
Iran
3
Department of Civil Engineering,
Islamic Azad University,
Ardabil Branch,
Ardabil,
Iran
http://dx.doi.org/10.12944/CWE.10.Special-Issue1.114
Iranian Steel Design Code is based on American Steel Design Code. In American code, effective stress distribution zone under base plates is considered as rectangular zone and this stress distribution corresponds with IPB profiles, while in Iran, IPE profiles are used commonly. Answer to this question that “whether stress distribution associated with IPB profiles is same as using IPE profiles or not” is our research’s basis. Main goals of this study include: 1) manner of stress distribution under steel base plates supporting IPE and 2IPE profiles. 2) Effect of steel base plate thickness on stress distribution under steel base plates. 3) Effect of dimension of steel base plates on stress distribution in base plates. 4) Effect of cover plates thickness on magnitude and manner of stress distribution in steel base plates. In this study, initially theories proposed by researchers in relation to stress distribution under steel base plates were studied. Also, ANSYS Software has been used due to its nonlinear analysis capability. In present investigation, 9 models containing IPE columns with base plates in various thickness and dimensions and 27 models containing coadunate 2IPE columns accomplished with cover plates erected on base plates in various thickness and dimensions were selected, then the models were analyzed by ANSYS Software.
Copy the following to cite this article:
Athar S. M, Sadrjamali M, Noshahr M. B. Studying Stress Distribution Under Steel Base Plates Using IPE Profiles. Special Issue of Curr World Environ 2015;10(Special Issue May 2015). DOI:http://dx.doi.org/10.12944/CWE.10.Special-Issue1.114
Copy the following to cite this URL:
Athar S. M, Sadrjamali M, Noshahr M. B. Studying Stress Distribution Under Steel Base Plates Using IPE Profiles. Special Issue of Curr World Environ 2015;10(Special Issue May 2015). Available from: http://www.cwejournal.org/?p=10051
Download article (pdf)
Citation Manager
Publish History
Introduction
In recent years, many studies have been done in order to design base plates as well as to predict their behavior and to know stress distribution under them. Based on study done by Swiatek and et al, if the column is undergone high pressure, it is not necessary to use permanent vertical stiffener plates on base plates and it is better to use thicker base plates. In a study has been done by Murry(1983) on designing small-dimension base plates supporting I-shape columns under light loads, it has been found that thickness of base plates under light loads is lesser than required amount.
Other studies have been done by researchers such as Cantiliver, Kneen, Thornton, Fling, Ranzi, Stockwell and professor Klose on how to distribute stress under base plates. In this study, we mention these methods and their hypotheses briefly.
In Cantiliver theory proposed for an H-shape column, it has been assumed that stress distribution in base plates operates in an area equaled to 0.95 dc *0.8 bfc as has been shown in Figure.1.
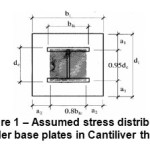 |
Figure 1: Assumed stress distribution under base plates in Cantiliver theory Click here to View figure |
In Fling theory, stress distribution is uniform along web and it’s both sides so that stress distribution intervenes by an angle such as θ from flange edges into plate inside. Also, it is assumed that flange edges bear no stress. Fling stress distribution has been shown in Figure.2.
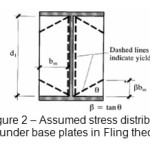 |
Figure 2: Assumed stress distribution under base plates in Fling theory Click here to View figure |
In Murry-Stockwell theory, stress distribution is considered as an H-shape region inside of an H-shape cross section. Figure.3 shows this stress distribution.
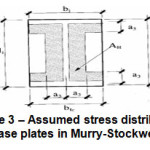 |
Figure 3: Assumed stress distribution under base plates in Murry-Stockwell theory Click here to View figure |
In Euro codes theory, uniform stress distribution is considered so that it has been initiated in a space outside of an H-shape cross section perimeter and then it has been developed inside of H-shape cross section perimeter. Figure.4 shows this stress distribution.
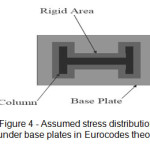 |
Figure 4: Assumed stress distribution under base plates in Eurocodes theory Click here to View figure |
For T-Stub theory, web and flanges are constituted from H-shape profiles separately, then, equivalent stress distribution are drawn for each one, afterward stress distribution for T-Stub method is obtained by adding distributed stress for both web and flanges of an H-shape cross-section. It should be noted that there is high stress at interface of web and flange due to adding web stress to flange stress. T-Stub distribution has been shown in figure.5.
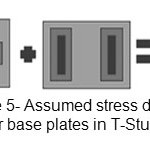 |
Figure 5: Assumed stress distribution under base plates in T-Stub method Click here to View figure |
Stress distribution under base plate assumed in Wolfram Klose theory, has been shown in figure.6.
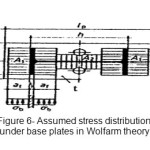 |
Figure 6: Assumed stress distribution under base plates in Wolfarm theory Click here to View figure |
Various Steel Base Plates Models with IPE18 Profiles
In all models of this part, concrete foundation is modeled as a spring. These springs are stuck to Nodes located beneath base plates. With regard to interweaving of base plates, one spring element is considered for each Node. The other end of element is considered as a cantilever end. Also loading on profile cross section is done as compressive load. In center of profile, two mutual Nodes are limited in x and y directions in order to prevent displacement of profile in x and y directions, so after loading, the profile can move only in a direction perpendicular to base plate. This loading has been continued to stage which profile is failed. Failure diagrams have been drawn by line 1 and line2 paths and stress distribution under base plate and stress variations have been drawn in line3 and line4 paths, respectively. In this part, thickness of base plates is selected equaled to 1 cm, 1.5cm and 2 cm. Also, corresponded dimensions for them are 35cm *35cm, 45cm *45cm and 55cm *55cm, respectively. Combination of these dimensions has resulted to 9 models (A1, A2, A3, A4, A5, A6, A7, A8 and A9). In all of these models, IPE18 profile has been used for columns. Figure.7 shows derails of base plates with IPE18 profiles.
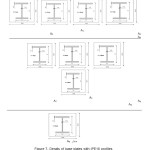 |
Figure 7: Derails of base plates with IPE18 profiles Click here to View figure |
Various Steel Base Plates with 2IPE Profiles
In this part, thickness of base plates for all models is same and equaled to 2cm. 2IPE18, 2IPE22 and 2IPE24 profiles has been used for columns. Dimensions of base plates are 35cm*35cm, 45cm*45cm and 55cm*55cm. Thickness of cover plate is 6, 10 and 14 mm. Height of cover plates for all models is 15cm and their length equals to sum of two profile lengths. By combination of these dimensions, 27 models (A, B ,C, D, E, F, G, H, I, J, K, L, M, N, O, P, Q, R, S, T, U, V, W, X, Y, Z, AA) were obtained so that they are different from each other in term of dimension of base plate, thickness of cover plate and number of IPE profiles. More details for these 27 models have been shown in Figure.8.
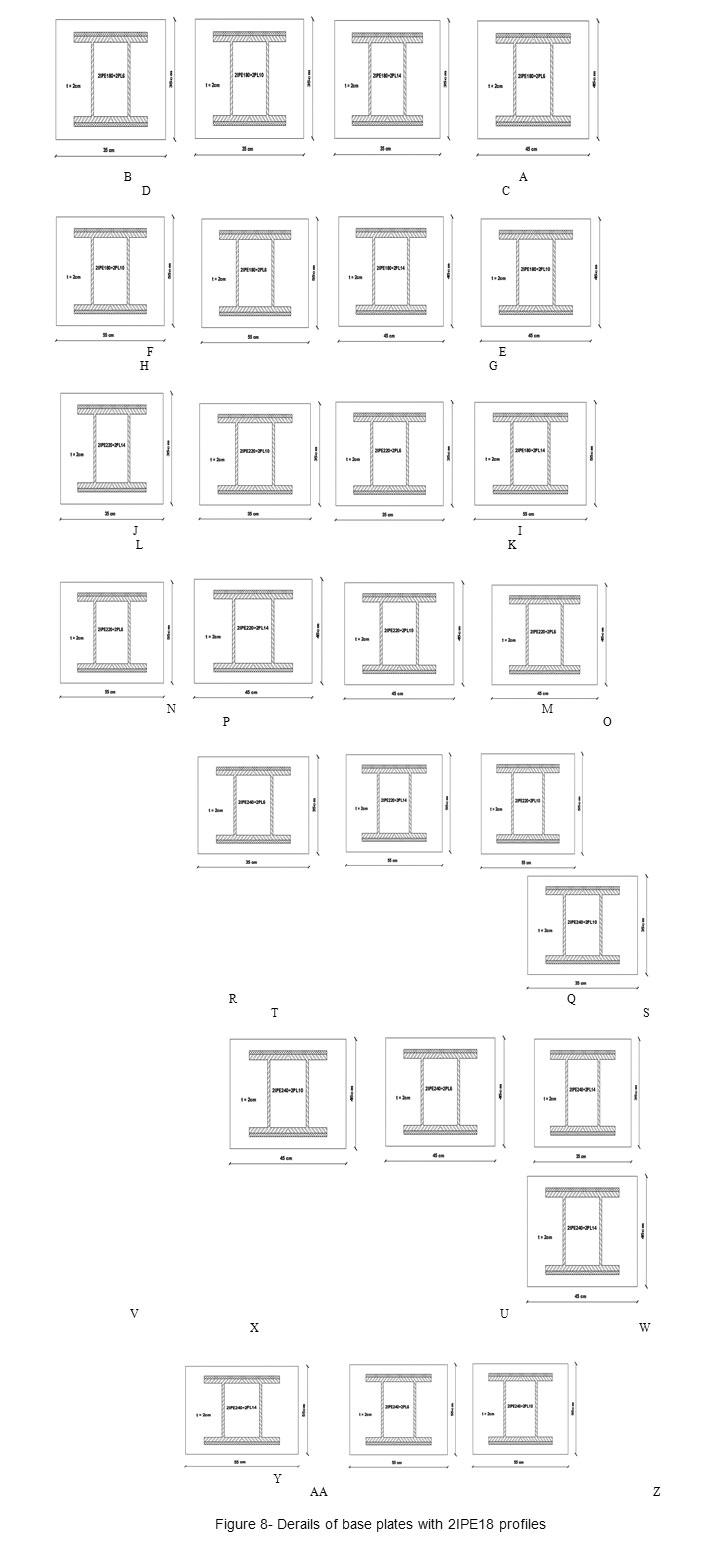 |
Figure 8: Derails of base plates with 2IPE18 profiles Click here to View figure |
Mode of Stress Distribution In A1 To A9 Steel Base Plates
Mode of stress distribution in A1 to A9 steel base plates is same with regard to form of distribution. In Figure.9, mode of stress distribution has been shown for model A9.
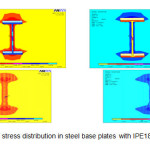 |
Figure 9: Mode of stress distribution in steel base plates with IPE18 profiles (model A9) Click here to View figure |
It is clear from above figures that range of stress distribution under base plates is symmetric in two sides of both web and flange and stress distribution range in vicinity of flange is more than surrounding of web.
Amount of Stress Distribution in A1 to A9 Steel Base Plates
Mises stress variations have been drawn in order to obtain amount of stress distribution range in proximity of flange and web in two assumed paths (line3 and line4 paths). Figures 10 and 11 show these assumed paths and Mises stress variations along line3 and line4 paths, respectively.
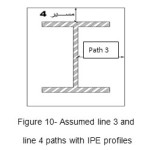 |
Figure 10: Assumed line 3 and line 4 paths with IPE profiles Click here to View figure |
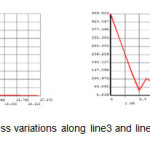 |
Figure 11: Mises stress variations along line3 and line4 paths with IPE profiles Click here to View figure |
Effect of Steel Base Plate Thickness on Effective Ranges of Mises Stress Distribution for Steel Plate in Line3 and Line 4 Paths
By effective range of stress distribution, we mean the stress range in which stress variation is high i.e. in this range, initially stress is in its maximum level and it decreases gradually linearly to amount after which stress variation is slight and uniform (Figure.11).
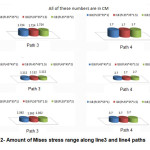 |
Figure 12: Amount of Mises stress range along line3 and line4 paths Click here to View figure |
As you can see in figure.12 (for line3 and line4), if dimension of base plate be remained constant and then its thickness has been varied, effective range of stress distribution in line3 and line4 will be remained constant. Amounts of effective range of stress distribution have been shown in figures. By comparing both two diagrams for two paths for a particular model, we can see that effective range of stress distribution in line 4 is more than that of line3. If thickness of base plate to be increased, ratio of effective range of Mises stress in vicinity of flange to effective range of Mises stress in proximity of web will be increased. (Column profile: IPE18 and dimensions of base plate: 35 cm *35 cm *1 cm).
Effect of Steel Base Plate Dimensions on Effective Range of Mises Stress Distribution in Steel Base Plate for Line 3 and Line 4 paths
Figure13 shows amount of effective range of Mises stress along line3 and line 4 paths.
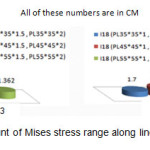 |
Figure 13: Amount of Mises stress range along line3 and line4 paths Click here to View figure |
Form this figure, it is clear that if dimension of base plate to be increased, effective rang of stress distribution in line3 doesn’t traverse any particular route so that sometimes it has decreased and sometimes it has increased. But with refer to line4, it can be concluded that effective range of stress distribution in line4 (i.e. edges of profiles flange) has increased by increasing dimensions of base plate. Also by increasing dimensions by 10cm, amount of effective range of stress distribution in proximity of flange has increased by 1cm. By comparing these two diagrams, we can find that effective range of stress distribution in line4 path is more than effective range of stress distribution in line3 path. This is evident in higher thicknesses. For plate thickness equaled to 1.50 cm and 2cm, effective range of stress distribution in proximity of flange is 2.4-2.7 times more than effective range of stress distribution in adjunct of web (3.7/1.362=2.712, 2.7/1.112=2.428).
On the other hand, for base plate which its thickness is 1cm, ratio of stress distribution effective range in flange vicinity to web vicinity is 0.98. For plates which their thickness is lesser than 1.50cm, we can say that effective range of stress distribution in proximity of web and flange is same. For thickness more than 1.50cm, effective range of stress distribution in proximity of flange is 2.4-2.7 times more than effective range of stress distribution in adjunct of web.
Mode of Stress Distribution in Steel Base Plates A to AA
For A to AA steel base plates, mode of stress distribution is same with regard to form of distribution. In figure.14, mode of stress distribution has been shown for model A.
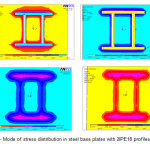 |
Figure 14: Mode of stress distribution in steel base plates with 2IPE18 profiles (model A) Click here to View figure |
It is clear from above figures that range of stress distribution under base plates is symmetric in two sides of both web and flange and stress distribution range in vicinity of flange is more than surrounding of web.
Amount of Stress Distribution Range in A to AA Base Plates
Mises stress variations have been drawn in order to obtain amount of stress distribution range in proximity of web and flanges in assumed line3 and line4 paths. Figure.15 shows these assumed paths.
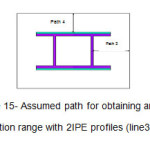 |
Figure 15: Assumed path for obtaining amount of stress distribution range with 2IPE profiles (line3 and line4 paths) Click here to View figure |
Effect of Base Plate Thickness On Effective Ranges of Mises Stress Distribution in Steel Plate for Line3 And Line4 Paths
Figure.16 shows amount of stress range along line3 and line4 paths. As you can see in figure.16, in these models, dimension of 2IPE24 profile and base plates have been remained constant and thickness of cover plates has been varied in order to study effects of them on effective ranges of stress distribution in steel base plates in line3 and line4 paths. It is clear from these diagrams that as thickness of cover plate has been increased from 6mm to 14 mm, effective range of stress distribution in line3 path ( in vicinity of web) has remained constant while effective range of stress distribution in line4 path has decreased. This reduction is regular so that effective range of stress distribution has had 1mm reduction respect to previous state per each 4 mm increase in thickness of cover plate.
 |
Figure 16: Amount of stress range along line3 and line4 paths with 2IPE profiles Click here to View figure |
Effect of Base Plate Dimensions on Effective Ranges of Mises Stress in Base Plate for Line3 and Line4 Paths in S to AA Models
Figure.17 shows amount of Mises stress range along line3 and line4 paths in S to AA models. Dimensions of IPE24 profiles and cover plates, dimensions of base plates have been varied in order to study their effect on Mises stress distribution range under base plates in line3 and line4 paths.
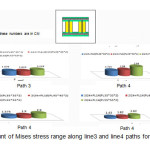 |
Figure 17: Amount of Mises stress range along line3 and line4 paths for S to AA models Click here to View figure |
As you can see from Figure.17, effective ranges of Mises stress variations in line3 and line4 paths have increased as dimension of steel base plates increased from 35cm to 55cm.
Conclusion
- Amount of stress under profiles is maximum and its value is decreased gradually toward plate edges. Always, maximum stress in start point of line4 path is higher than maximum stress in start point of line3 path.
- The stress in vicinity of web and flange is symmetric, i.e. effective range of stress distribution in both web and flanges is symmetric always while in most theories stress distribution range is considered only in one side of flange or web.
- Stress distribution range in proximity of flanges is more than that of in web vicinity while in many theories proposed by researchers; stress distribution range in both web and flange has been considered same.
- For base plates with IPE profiles, in all states, effective range of stress distribution in proximity of both web and flange have remained constant by varying thickness of base plates and fixing dimensions of plates.
- By comparing stress distribution obtained for all models due to proposed theories, we can conclude that acquired results are close to Wolfram Klose theory because in both Wolfram Klose and this study, effective range of stress distribution in vicinity of flange is more than effective range of stress distribution in proximity of web. This theory considers stress distribution range symmetrically in proximity of web and flange so it corresponds with stress distribution obtained for this study models.
References
- Eurocode 3, Design of stell structures DD EnV 1993-1-1 Part1.1 General rules and rules for buildings,(1992).
- Murray,T.M., Design of Lightly Loadef Steel Column Base Plates, Engineering Johrnal AISC, Vol. 20,pp.143-152., (1983)
- Ranzi, G. and Kneen, P., Design of Pinneed Column Base Plates. Steel Construction, Vol 36 No 2, Australian Steel Institute, Australia, (2002).
- Swiatek, D. and whitbeak, E., Moden Steel Construction, AISC Steel Solutions Center.pp.3, (2004).


